|
|
|
I had to put the data on different graphs so the graphs need to be looked
at
one underneath the other....for example throttle position should be
looked at
in reference
OK, here are the graphs!
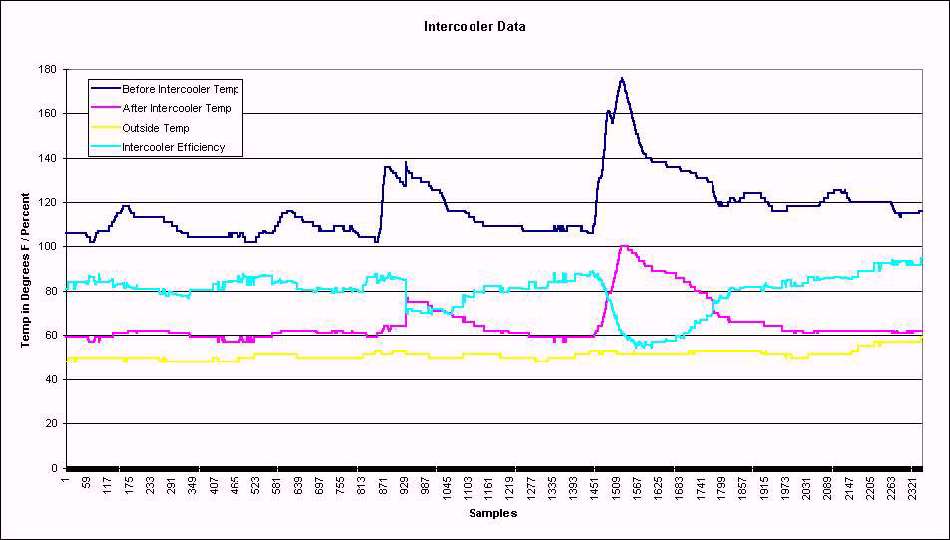
The first graph is intercooler data. This graph shows the temp.
of the air before the intercooler
(right after the turbo has compressed it), the temp. of the air after
the intercooler (right before
it enters the throttle body), intercooler efficiency (100% max), and
the outside temperature all in
degrees F. A 100% intercooler efficiency would mean that the
after intercooler temperature is
equal to the outside air temperature.
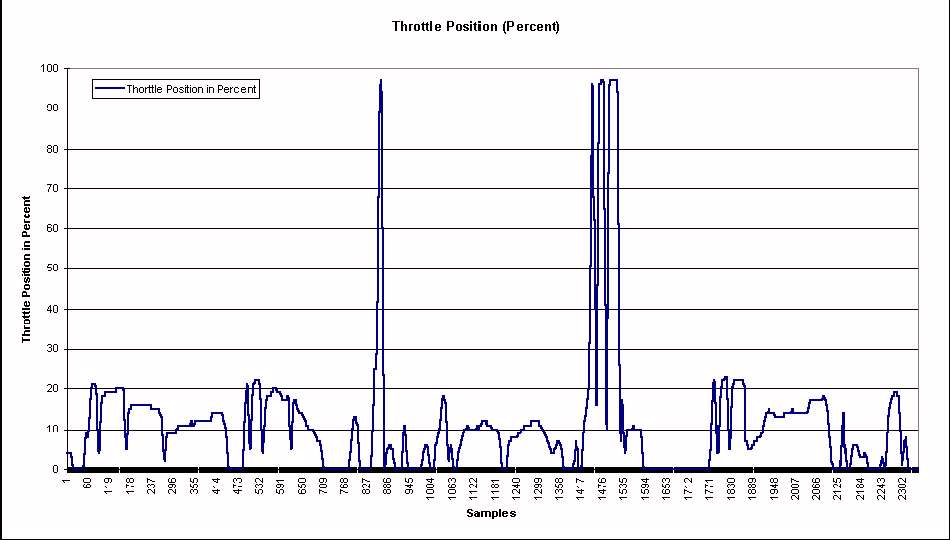
The next graph shows throttle position (ie where my right foot it is!)
in percent. Slight problem with the code
shows that about 96% throttle is actually full throttle (just didn't
scale it right).
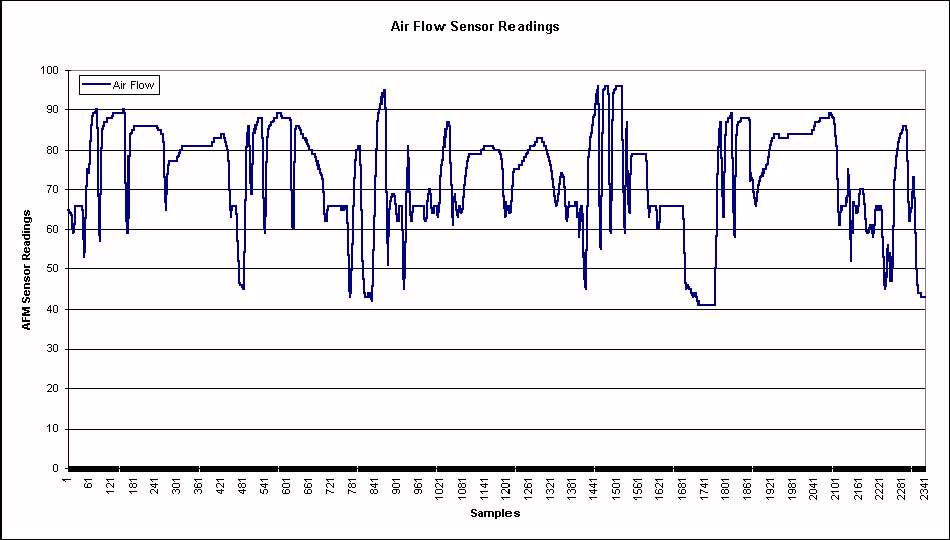
The next graph shows the signal from the air flow meter. I attempted
to scale it to a percent, but I wasn't too
successful, however the data is still useful. It seems that the
ECU relies on this signal more than others (ie TPS etc)
to determine fuel delivery (if that makes sense).
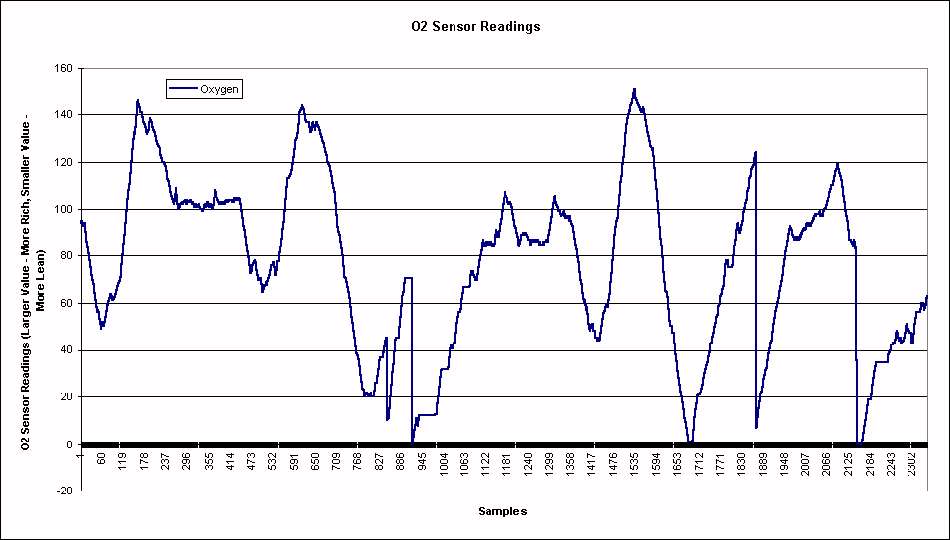
The next graph shows the fuel mixture. This data was taken right
from the stock O2 sensor. Higher values indicate more rich
and lower values indicate more lean. Look closely at the relationship
between the following graph an Throttle position, the oxygen
signal slightly lags that of the TPS signal.
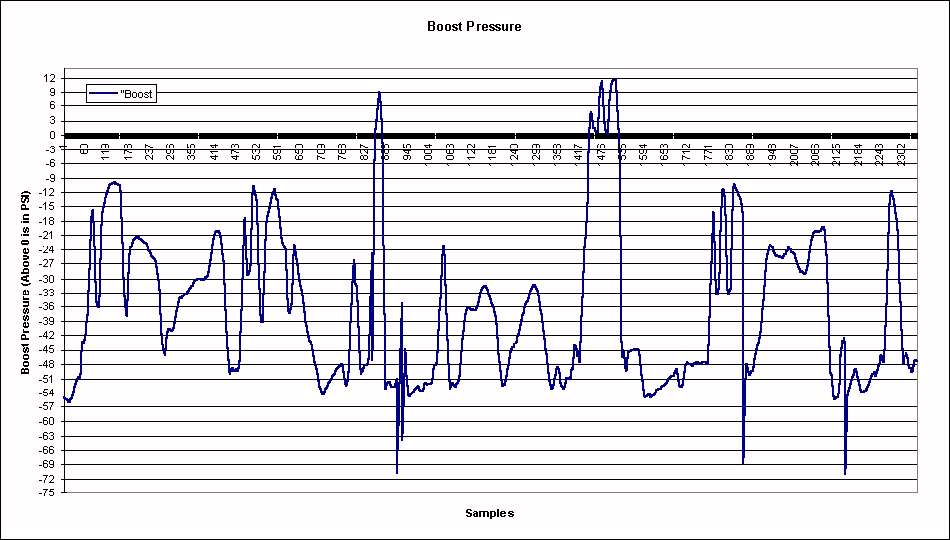
The following graph shows the boost pressure as read from the APEXi
AVC-R's pressure sensor. The stock sensor can
be used as well.
NOTE: Above 0 is in PSI (ie max hit here is 12 psi). Below
zero is a vacume, and I have not scaled that
appropriatly yet (so it is unitless).
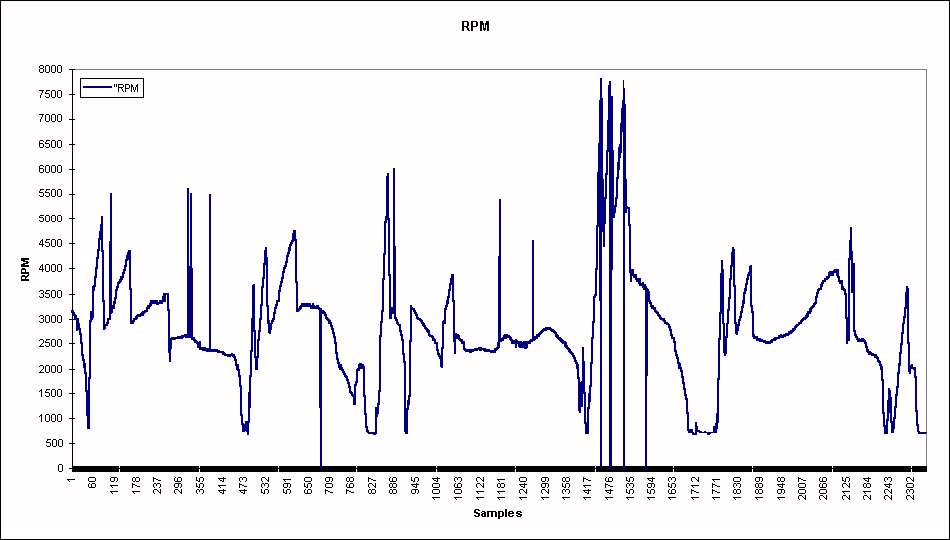
The final graph shows engine RPM. There is a slight problem in
the code, and the RPM seems to be showing
a little high. (I normally don't shift at 7500RPM!)...but it
isn't too bad. :)
That's it! Hope you find this useful...please let me know what
you think.
email me at joeo@nssolutions.com.